
An unsustainable move, the post-coronavirus increase in housing prices is one we believe is likely to reverse itself over the intermediate period ahead. Investors should pay attention to ramifications of this housing forecast, as it has material implications for the individual investor and the broader economy.
In the summer of 2005, alarm bells were ringing around our office regarding the state of the housing market. As a result, we felt obligated to communicate our concerns to clients, and we issued a note to our clients about the risks in the housing market and the factors that fostered that appreciation of housing prices.1 Our conclusion was that speculating in residential real estate could be, at the time in 2005, harmful for your financial health. In the face of another massive surge of U.S. housing prices over the past several years, we are reminded of our prescient warnings in that letter.
While financial markets rarely repeat themselves, they certainly do rhyme. Today is one of those times, when it seems to us that the sustained strength of the U.S. housing market is starting to rhyme with history. Or, at least, the alarm bells associated with the housing market are rhyming.
In the wake of the Great Financial Crisis, many of the dangerous innovations in mortgage finance (e.g., reverse mortgages, mortgages with zero down payments) were severely rolled back. Moreover, regulators demonstrated a resolve to be far keener in paying closer attention to the housing market, given that this asset is typically the most valuable asset for the median net worth American family. Post-2008, housing prices have been climbing at a reasonable pace, but it was not until the coronavirus pandemic raised its ugly head that housing prices started to accelerate.
During the coronavirus pandemic, the Federal Reserve slashed short-term interest rates back to 0% to bolster asset prices and the economy. Long-term interest rates fell to the point that, in December 2020, the average 30-year fixed-rate mortgage reached an all-time low of 2.66%.2 In addition, the Federal government flooded the system with fiscal spending to prop up asset prices and expand liquidity. As people were working from home exclusively for years and spending far more time in their homes than before, investments in home renovations and upgrading homes accelerated significantly. Demand for homes around the country has outpaced supply since March 2020. As a result of the confluence of these factors, housing prices surged more than 40% nationally since the outbreak of the coronavirus – a reflection of the inflation seen seemingly everywhere in today’s economy.3
The chart provided at the top of the next page transposes 30-year fixed mortgage rates relative to housing affordability. The blue line represents housing prices relative to median incomes, which highlights that the amount of money that the average American spends to become a homeowner relative to their income has been increasing to the point that it is now higher that it has been in any point in time in at least the last 35 years. At the same time, 30-year mortgage rates, represented by the red line, have spiked materially since the 2020 bottom, although they have not reached the heights reached during the 1980s.
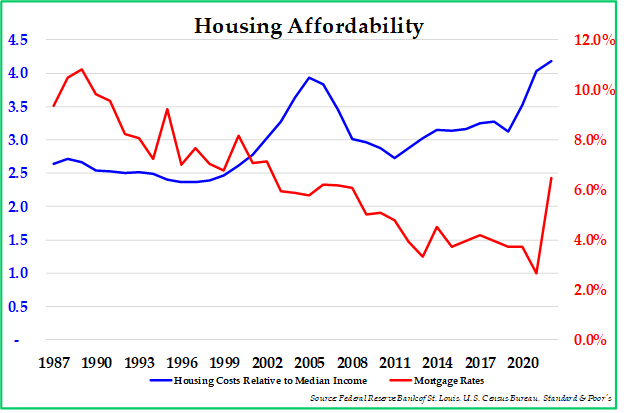
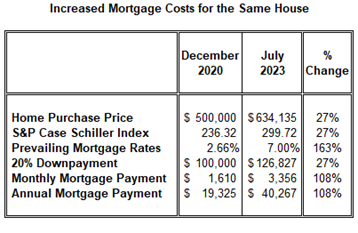
Since the beginning of 2022, the Federal Reserve has been aggressively hiking interest rates to try to quell inflation. In July 2023, the average 30-year fixed rate mortgage climbed past 7.0%, representing a 163% increase relative to the December 2020 all-time low of 2.66%. That means that, for new mortgages, the average mortgage payment for the same home that was sold with a fixed rate mortgage is up a whopping ~108% relative to December 2020 (see table on the right). That implied increased mortgage payment should act as a severe headwind for housing prices, which has not yet manifested itself.
We do not believe that the recent spike in housing costs foretells a repeat of 2008. We have not seen droves of forced sellers with no equity in their homes defaulting contemporaneously on their mortgages. The reforms put in place in the wake of the Great Financial Crisis should maintain market stability and keep the banks from stepping on their toes once again. With low unemployment rates and a healthy U.S. economy, most homeowners should be able to meet their mortgage obligations. In addition, housing, as always, remains a local market, and the impact of accelerating prices in Miami is unlikely to have an impact on the housing market in Omaha.
Nevertheless, we believe a decline in house prices is warranted. Similar to what transpired in 2008, U.S. housing prices need to fall nearly 30% for the housing costs relative to incomes to reach a historical mean. However, inflation remains high; rising incomes could play a role in correcting the imbalances in the housing market. During the 1955-1975 period, incomes grew far faster than house prices, causing houses to become much more affordable for the average home buyer.4 Given the tight labor market and elevated inflation along with the high price of housing, it could very well be that incomes rise sufficiently to catch up with house prices over a multi-year period. In our view, housing prices are likely to fall and incomes are likely to continue to rise over the intermediate period ahead.
A market slow to move, housing is in the middle of a significant price discovery process. Should housing prices falter over the intermediate period ahead, it is reasonable to assume that the broader economy will face material headwinds associated with a weak housing market, albeit buttressed by rising incomes. In echoing our sentiments from 2005, we close this Navigator by communicating a simple message – speculating in residential real estate at this time could be hazardous to your financial health. For those wishing to purchase second homes, particularly so in overheated markets, we think consideration should be given to renting.
We would also note that real estate is a local market, and our comments are based on national macroeconomic data. If you have specialized knowledge about a particular property or a particular neighborhood, it may well be that our macroeconomic-based commentary does not apply.
Should you have any questions about the contents of this letter, please do not hesitate to reach out to us.
1 https://pekinhardy.com/betting-the-house-u-s-housing-market/
2 The Federal Reserve Bank of St. Louis.
3 S&P Case-Schiller Index.
4 The Federal Reserve Bank of St. Louis
The commentary in this video and article was prepared by Pekin Hardy Strauss, Inc. (“Pekin Hardy”, dba Pekin Hardy Strauss Wealth Management) for informational purposes only (and is not intended as an offer or solicitation for the purchase or sale of any security.) The information and data in this article and video do not constitute legal, tax, accounting, investment or other professional advice. The views expressed are those of the author(s) as of the date of publication of this report and video, and are subject to change at any time due to changes in market or economic conditions. The comments should not be construed as a recommendation of individual holdings, market sectors or any particular strategy, there is no guarantee that the strategies discussed herein will outperform any other. Although information has been obtained from and is based upon sources Pekin Hardy believes to be reliable, we do not guarantee its accuracy. There are no assurances that any predicted results will actually occur. The Consumer Price Index for All Urban Consumers (CPI-U) is a monthly measure of the average change over time in the prices paid by consumers for a market basket of consumer goods and services, based on the spending patterns of urban consumers.