
“For on one side lay Scylla and on the other divine Charybdis terribly sucked down the salt water of the sea. Verily, whenever she belched it forth, like a cauldron on a great fire she would seethe and bubble in utter turmoil, and high overhead the spray would fall on the tops of both the cliffs.”
─ The Odyssey, as spoken by Odysseus
In Homer’s The Odyssey, Scylla, a terrifying six-headed sea monster, and Charybdis, a violent whirlpool, are dangerous sirens that live on opposite sides of the Strait of Messina that stretches between the island of Sicily and the toe of mainland Italy. The protagonist, Odysseus, must sail between Scylla and Charybdis on his way home to Ithaca after the Trojan War. In this mythical situation, Odysseus must choose between equally dangerous extremes that may lead to utter disaster.
In January 2021, our quarterly investment commentary provided an analysis of future returns from the bond market. In that analysis, we compared Scylla and Charybdis to bonds with near-zero income yields and stocks with increasing volatility. With the benchmark 10-year Treasury bond yielding a measly 1.1% and a record $18 billion in global bonds trading with a negative yield at the time, we stated unequivocally that the bond market had become almost uninvestable. Today, we are partially reversing our call against bonds – we believe that the short-end of the Treasury market offers a unique, temporary opportunity on which investors should capitalize. We no longer believe that short-term Treasury bonds are comparable to either Scylla or Charybdis.
Historically, we have maintained an allocation to bonds in our client portfolios for two primary reasons: 1) bonds provide a fixed return if held to maturity, which can be attractive to clients who need portfolio income to fund their living expenses; and 2) bond prices are less volatile than stocks, and, for the majority of time during the last 40 years, bonds have been relatively uncorrelated to stock prices, providing a diversification benefit from owning bonds and stocks together in a balanced portfolio.
During the coronavirus pandemic, global bond yields fell to all-time lows (and bond prices, which move inversely to yields, rose to all-time highs). With the 2-year Treasury yielding <0.1% and the 10-yr Treasury yielding just over 0.50% in the summer of 2020, it was not an auspicious time to invest in bonds – hence, our caution. However, after 18 months of aggressive interest rate increases by the Federal Reserve, the effective Federal Funds rate now stands over 5%, and essentially all the global bonds that had negative yields in 2020 have since swung into positive territory. Currently, the short end of the bond market (i.e., a duration of less than two years) has become a far more intriguing place in which to deploy capital, and client investment portfolios have already started to reflect that attitudinal shift. At the beginning of July 2023, the yield to maturity of the one-year U.S. Treasury bond breached 5% and now stands at levels not seen in the last 23 years.
To better understand the growing attractiveness of short-term Treasury bonds, we should review the three primary ways that investors bear risk and generate investment returns from bonds in general and short-term Treasury bonds in particular:
- Interest rate risk
Interest rate risk is the potential for investment gains and losses that can be triggered by moves in prevailing interest rates. When interest rates rise, bond prices decline; the converse of that statement holds true as well. In addition, interest rate risk amplifies investment returns for long-dated bonds; that means that long-term bonds will move more in price in response to interest rate changes than short-term bonds. with the 10-year Treasury only offering yields at ~4.0%, investors are, in our view, not compensated enough to bear the interest rate risk. On the other hand, investors can generate ~5.3% returns from U.S. Treasuries at the short end of the yield curve and not worry much about increases in interest rates because the bonds will mature relatively soon and investors can then reinvest the capital at prevailing rates.
– - Credit risk
Credit risk represents the possibility of a loss resulting from a particular borrower’s failure to repay a bond; investors generate incremental returns by bearing that risk. Because the U.S. government has taxing power and owns the printing presses for dollars, U.S. Treasury bonds essentially do not bear any credit risk. Certainly, investment grade or high-yield corporate and mortgage bonds offer higher yields than those from Treasury bonds, but credit spreads remain relatively tight, making the risk/return profile of bearing material credit risk relatively less appealing at the present moment.
– - Currency risk
Currency risk represents the potential for gains or losses based on fluctuations in the currency of a bond denominated in another currency. Because U.S. Treasury bonds are denominated in U.S. dollars, the currency risk for Treasuries is zero for U.S.-based investors.
Moreover, the U.S. Treasury market is the largest and most liquid market in the world. Treasuries are used to finance the U.S. government, manage interest rate risk, act as a risk-free benchmark for pricing other financial instruments, and assist the Federal Reserve in implementing monetary policy. For all those reasons, the liquidity in the U.S. Treasury market is of great importance for market participants in essentially all asset classes. In the case of our clients, this high level of liquidity also matters because these assets act as a high-yielding cash equivalent that can be deployed in other securities when values in other securities when investment bargains arise.
Today’s unusually inverted shape of the yield curve informs our views on the relative attractiveness of shorter-term bonds. Normally, the yield curve is upward sloping, meaning that short-term borrowings pay less interest than long-term borrowings. This is natural, as most lenders would require more interest to tie up money for longer periods of time. However, the yield curve is currently inverted (as demonstrated in the chart below), which means that short-term interest rates exceed long-term interest rates.
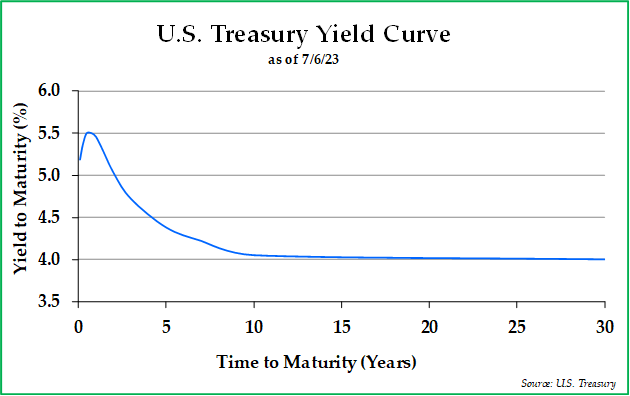
An inverted yield curve typically does not last for very long. In addition, since most banks and other lenders generate profits from borrowing lower-cost short-term funds and lending at higher-cost long-term loans, an inverted yield curve wreaks havoc on their business models. And usually, when the banking system is ailing and cannot generate profits on lending, then banks’ relatively less ability to offer credit feeds through to the rest of the economy.
Thus far, the yield curve has been inverted for roughly one year, and the longest inversion in modern U.S. economic history transpired during the deep recession of 1981-1982, when the inversion lasted 22 months. In our view, one of two scenarios will likely occur in the coming year. In the first scenario, the U.S. economy would enter into recession, and the Federal Reserve would likely be forced to cut interest rates to provide monetary stimulus, which would un-invert the yield curve. In the second scenario, the U.S. economy might avoid a recession, and a strong economy and persistent inflationary forces would cause the long end of the yield curve to rise and un-invert the yield curve. With higher yields on long bonds, most financial assets would sell off in response. In either scenario, parking a portion of client capital in one-year Treasuries and earning ~5.3% seems prudent.
The chart below provides a comparison between the earnings yield of the S&P 500 Index and the yield to maturity for the one-year Treasury bond.1 The earnings yield is the inverse of the price/earnings valuation ratio, which means that, if the S&P 500 Index has a P/E of 20x, then its earnings yield is 5%. The earnings yield for the S&P 500 Index currently stands at 5.2%, which is not as low as it reached during the depths of the coronavirus pandemic but is relatively low from a historical standpoint. The one-year Treasury is currently yielding ~5.3%, which is the highest yield afforded to investors for this security in more than two decades.
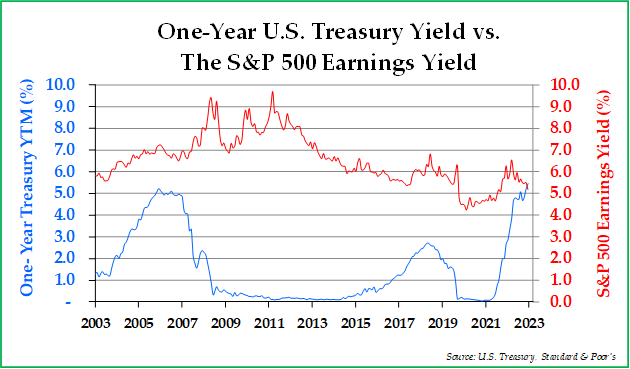
In theory, when bond yields are higher than equity yields, incremental capital should flow from equities to bonds. This theory makes logical sense, as the future expected returns from the S&P 500 Index are seemingly not that different than that of the one-year Treasury, and the future investment return of the one-year Treasury is more or less fixed at the time of purchase, while the future returns of the S&P 500 Index are far more uncertain.
Today, there are two primary risks to owning short-term Treasury bonds. The biggest risk for owning short-term Treasuries is inflation risk. As of June 2023, the Consumer Price Index (CPI) reflected a 3.0% inflation rate. Thus, if one were to purchase the one-year Treasury, the nominal rate of return would be ~5.3%, and the real or inflation-adjusted rate of return would be 2.3%. If the CPI were to increase above 5.3%; however, the rate of return achieved by the one-year Treasury would be negative on an inflation-adjusted basis. As for the other risk referenced, should other investments provide more attractive returns over the next 12 months, then there would be opportunity costs borne by the investor. However, given the tight spread between equity earnings yields and short bond yields, it would seem to us that the possibility of a material opportunity cost at present would be low.
This is not to say that investors should sell all their stocks and buy one-year Treasuries. Rather, we have been trimming or liquidating those investments that are closer to our estimates for intrinsic value and buying short-term Treasuries with the cash generated. With those stocks that have significant expected upside relative to the current price, we are holding or even buying more of those securities. Given the unique and seemingly temporary shape of the yield curve at the present moment, we do not expect this set of circumstances to remain in place for long. In summary, we believe short Treasuries are attractive investments and are worth owning.
We thank our clients for their continued support of us in the management of their investable assets. Should you have any questions about the contents of this letter, please reach out to us.–
*****
Sincerely,
Pekin Hardy Strauss Wealth Management
1 Typically, the “Fed Model” provides valuation comparisons between equity earnings yields and the 10-year Treasury yield. However, given the anomalously inverted nature of the yield curve and the relative attractiveness of shorter-dated bonds, we thought it would be appropriate to compare earnings yields relative to the one-year Treasury yield.
This article is prepared by Pekin Hardy Strauss, Inc. (“Pekin Hardy”, dba Pekin Hardy Strauss Wealth Management) for informational purposes only. The information and data in this article do not constitute legal, tax, accounting, investment or other professional advice. The views expressed are those of the author(s) as of the date of publication of this report, and are subject to change at any time due to changes in market or economic conditions. There is no guarantee that the types of investments discussed herein will outperform any other investments in the future. Although information has been obtained from and is based upon sources Pekin Hardy believes to be reliable, we do not guarantee its accuracy. There are no assurances that any predicted results will actually occur. Past performance is no guarantee of future results. The S&P 500 Index includes a representative sample of 500 hundred companies in leading industries of the U.S. economy, focusing on the large-cap segment of the market. The Consumer Price Index (CPI) is an unmanaged index representing the rate of the inflation of U.S. consumer prices as determined by the U.S. Department of Labor Statistics.