
Photo by jayzynism.
“I’m convinced that everything
that’s important in investing is counterintuitive,
and everything that’s obvious is wrong.”
– Howard Marks, Co-Founder of Oaktree Capital Management
Don’t let the conservative dress habits of the financial services industry fool you; the financial world is far from immune to fashion trends, at least when it comes to financial products. Financial fashionistas pioneered the Nifty Fifty in the 1970s, the Dot-Com Bubble in the 1990s, and Collateralized Debt Obligations (CDOs) in the 2000s, to the great benefit of the investment banking industry and to the detriment of their clients.1
Today, passive investments, also known as index mutual funds and index exchange traded funds (ETFs), are all the rage in the financial services industry, with the primary benefits of passive investing being low fees and high levels of diversification. The question at hand is, does passive investing deserve the hype it receives? According to the financial press, playing its usual role as the promotional engine of the latest financial fashion, the answer is an obvious and resounding yes. Our own answer is that, like all financial product fashions, today’s excessive interest in passive investments has generated a rush through the passive investing doors that creates significant risks; in our opinion, most long-term investors are better off relying on the capable hands of a trusted, and active, investment advisor.
To disclose our bias on this question, we are dyed-in-the-wool active investors, through and through. We take an active approach in our client accounts, in the mutual fund we manage, and in our own personal investments.
A Brief History of Passive Investing
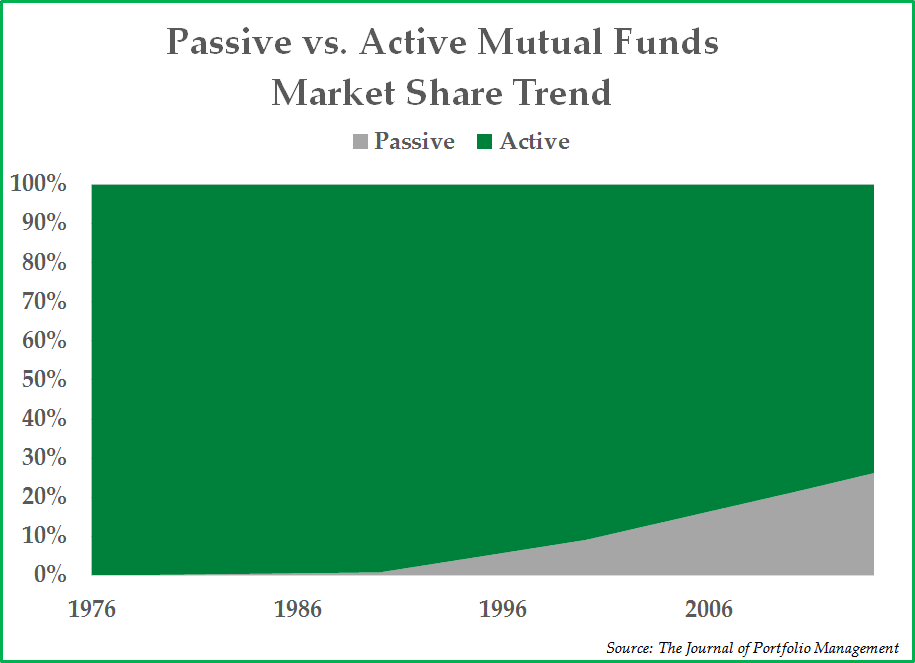
The first index fund, now known as the Vanguard 500 Index Fund, was launched in the mid-1970s by John Bogle, founder of the Vanguard Group. Vanguard has grown since then in tandem with the popularity of index funds; currently, the company manages over $3 trillion in assets and has become the largest mutual fund manager in the United States. As Vanguard has grown, so too, have other companies that offer index funds and ETFs whose prices track various market indexes.
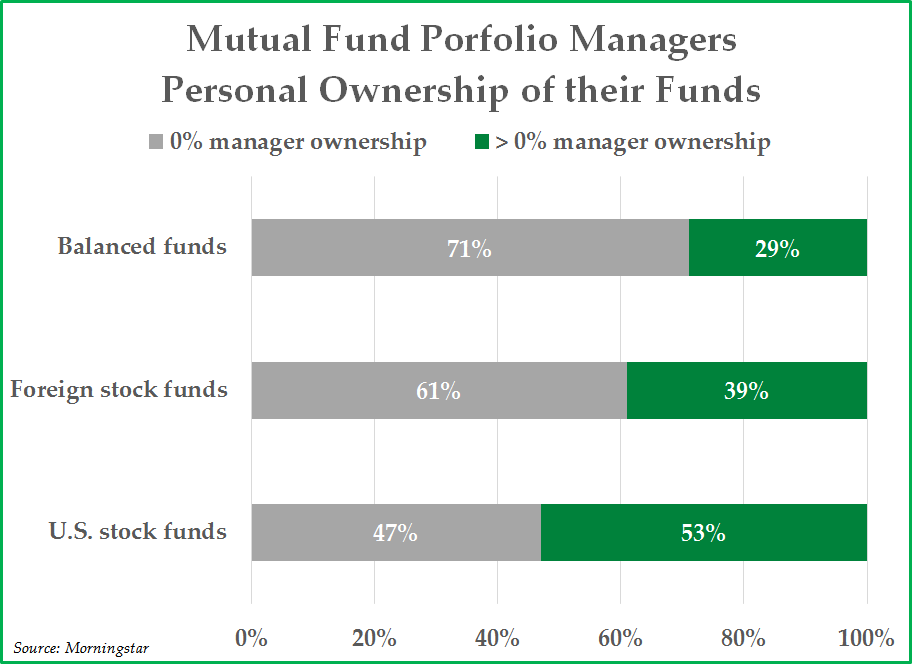
As seen in the chart on the previous page, more than $1 out of every $5 invested in the markets is invested through some form of a passive mutual fund or passive ETF. To be fair, passive index proponents have a valid point in their critique of actively managed mutual funds. Most actively managed mutual fund products can be bad for a person’s financial health, in our view. Too many active funds are notoriously high in fees and lucrative to a fault for the brokers who place their clients into these funds. In a majority of cases, the portfolio managers themselves do not own the products they manage for others (see chart to the below), and they are quick to jump ship to another mutual fund company as soon as a more attractive opportunity presents itself.
Worst of all, the investment strategy, more often than not, is an index hugging investment strategy, which means that the investment portfolio looks rather similar to a market index, but with far higher fees. When we choose actively managed mutual funds for clients, we have to be very selective. We have been critical of the broader mutual fund industry for many years, and in 2006 we launched our own mutual fund in order to offer a product that we believed solved many of these problems. We tried to make the fees reasonable, and we manage Appleseed Fund with little regard to benchmark indexes; Appleseed Fund is widely owned by Pekin Singer employees and portfolio managers alike.
While conceding that passive investment products provide important advantages over many actively managed funds, not the least of which is lower investment fees, passive index products create their own problems that are worth understanding and which go largely underreported in the financial press.
The Market-Weighted Index Problem
Most broad stock market indexes, such as the S&P 500 Index and the MSCI World Index, are constructed to be weighted by market capitalization, which means that large-cap stocks receive a far larger weight than small-cap stocks. As a result, broad stock market indexes, and the financial products that track such indexes, hold an overweight position in large-cap stocks and especially in the most expensive large-cap stocks.
The implication of weighting indexes by market capitalization is that, during liquidity fueled markets where unbridled investor optimism can cause excessive investment in certain sectors, passive investments can become hazardous to an investor’s financial health. Rob Arnott of Research Affiliates gets to the heart of the issue when he said:
“The Achilles’ heel of indexing is that when you have a bubble and a stock is trading way higher than it should, you have your peak exposure at its peak price.”2
As financial assets inflate during strong, momentum-driven bull markets, such as we have experienced the last few years, passive strategies tend to outperform active strategies. Over the last several years, large capitalization, expensive stocks like Facebook, Amazon, Netflix, and Google (the so-called “FANG” stocks) have outperformed considerably, and, due to their outsized weight in various market indexes, including the S&P 500 Index and the Nasdaq Composite Index, index products that track such indexes have outperformed many active managers with tremendous long-term track records.
However, the very same phenomenon that causes passive strategies to outperform during momentum markets usually leads to material underperformance once liquidity inevitably reverses and overvalued momentum stocks experience price deflation. This phenomenon can be seen graphically in the S&P 500 sector weighting chart below. Just prior to the bear market of 2000-2002, the largest industry sector in the S&P 500 Index by far was the technology sector due to excessive market valuations among technology stocks. Similarly, in the run up to the Financial Crisis in 2008, the largest industry sector in the S&P 500 Index in 2006 was the financial industry sector due to the housing credit bubble.
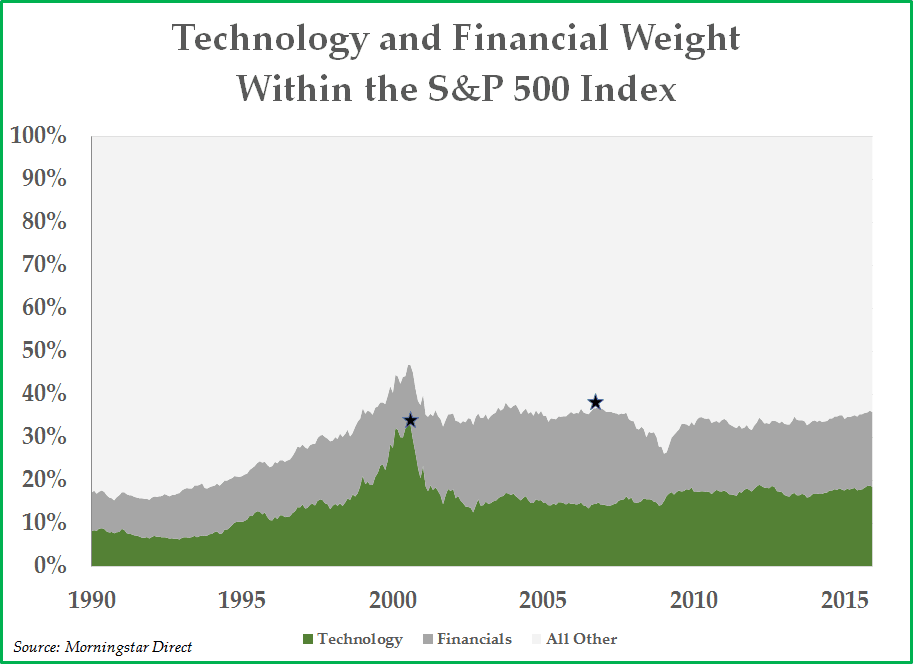
Precisely because market indexes are market cap-weighted, passive investors are overweight the riskiest, most expensive sectors at the riskiest time in the market cycle. On the other hand, an active manager can choose to take appropriate actions to mitigate these risks. Active investors who avoided excessively priced technology stocks during 2000-2002 outperformed by protecting capital and limiting downside risk, just as active investors who were underweight leveraged financials with credit risk between 2006 and 2008 outperformed. Passive investors in market capitalization weighted index products, by definition, must hold overweight positions in the most expensive, riskiest sectors. Today, the markets are seven years removed from the Financial Crisis, and the risk of owning the S&P 500 Index might appear to be a far-fetched one to the passively inclined investor. We respectfully disagree.
Over the long-term, it is not large-cap growth stocks that have historically outperformed broader market indexes. Research suggests it is value stocks and small-cap stocks that have outperformed. Unfortunately, undervalued stocks are under-represented in market cap-weighted indexes, because they are inexpensive, while small-cap stocks are under-represented in market cap-weighted indexes because they have small capitalizations.
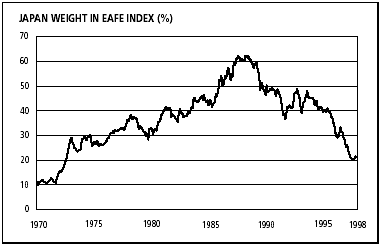
Furthermore, the market weighted index problem is not limited to the United States, and it is not limited to stocks. The largest country weighting in the MSCI EAFE World Index3 in 1989, by far, was Japan. As seen in the chart to the right, Japan’s weighting in the MSCI EAFE World Index at the peak was more than 60%. For more than 20 years leading up to 1989, Japanese stocks generated tremendous investment returns. In 1989, however, investors who wanted to passively invest in overseas stocks by purchasing the MSCI EAFE index were mostly just investing in Japanese stocks at the height of one of the largest stock market bubbles in history. Over the subsequent 25 years, the Japanese stock market generated a compound return of –2.7% per year.4 Today, at a time when Japanese stocks represent a far more attractive risk-reward profile to investors, Japanese stocks represent just 22.5% of the MSCI EAFE World Index.5
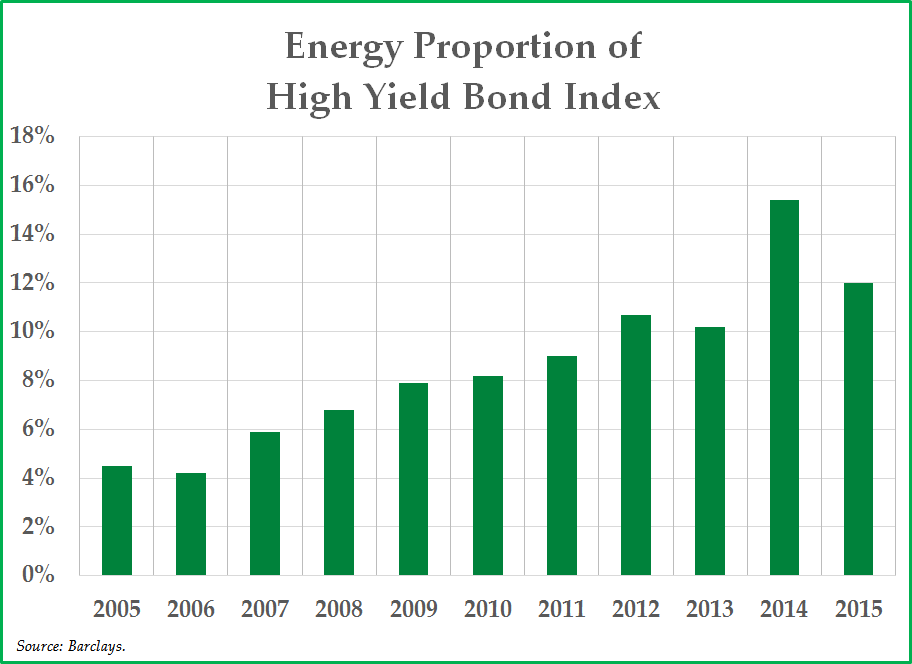
Similarly, bond indexes are weighted (down) by the countries and companies that issue the most debt. As a result, bond index funds and bond index ETFs tend to own overweight positions in the debt of the most indebted countries and companies. Unfortunately, with more indebtedness comes heightened volatility and the risk of permanent capital impairment. For example, as seen on the chart below, the high-yield debt issues of the energy sector grew in size to make up more than 15% of the Barclays U.S. Corporate High-Yield Bond Index in 2014, representing the largest industry sector, because it was the industry which experienced the most excess in terms of high-yield bond issuance for several years prior to 2014. Passive investors who owned the high-yield bond index at that time were, in effect, choosing to own an overweight position in the high-yield debt issues of the overleveraged energy sector. Unsurprisingly, recent investment returns of the high yield bond market have been lackluster. In 2015, the total return of the iShares high yield bond ETF (NYSE: HYG) was –5.0%, and, in 2016, the energy sector is currently leading the largest wave of corporate defaults in seven years.6
When to Invest Actively, When to Invest Passively
While investing differently than market indexes can be a long-term advantage for active investors, it also can be a challenging endeavor because it requires an investor to be ready and willing to be not only different from the market, but also be wrong, for an extended period of time. Disciplined active investors know this phenomenon from personal experience, but the challenges have historically resulted in long-term rewards. Active investors who are willing to invest differently from market indexes have an inherent advantage that allows them to side-step the market-weighted index problem. Avoiding significant pockets of investor excess (e.g., the Dot Com Bubble) can better position the active investor to outperform when excessively priced financial assets deflate.
It has now been seven years since investors have experienced a bear market of any lasting duration in the U.S. equity markets, which makes it difficult to remember why making active investment decisions can be helpful over the long-term. Investors have a psychological tendency to chase performance, and investors who are moving into passive index products are not immune from this age-old tendency. Therefore it is not a surprise that assets are flowing out of active strategies and into passive strategies en masse at the present moment, but, for the reasons we have been discussing, we think it’s a mistake.
Today, the valuation of the stock market in the United States remains high. A high valuation makes it easy for us to say that the medium term risk/reward profile of the S&P 500 Index is not attractive. Moreover, the poor risk/reward profile of the S&P 500 Index is hardly mitigated by owning an index fund with lower-than-average investment expenses. We would rather own a basket of stocks with an average 10x P/E ratio and pay 3% per annum in fees, for example, than own a basket of stocks with an average 25x P/E ratio and pay 0% per annum in fees.
In our view, in today’s environment, the superior way to invest to generate attractive long-term returns is to own investments that look different from the S&P 500 market index, particularly at the end of an extended bull market cycle. The prudent and intelligent approach, given the excessive valuation of the S&P 500 Index, is to own a combination of selective stocks with reasonable valuations, including small-cap equities and international equities, high grade fixed income, and capital set aside in the form of gold and cash to purchase stocks at a later date at lower prices.
We appreciate your trust in our ability to manage your liquid capital by making active investment decisions with your portfolio — especially so during periods when our active strategy underperforms the market index. We appreciate your patience during periods when our investments might be not only different than the market, but also wrong, for an extended period of time. We take a long-term view on investing, and we remain exceedingly grateful to have clients who share a similar perspective.
Sincerely,
Pekin Hardy Strauss Wealth Management
1 The Nifty Fifty refers to fifty popular large-capitalization growth stocks on the NYSE that propelled the bull market during the early 1970s, but the Nifty Fifty significantly underperformed the broader equity markets later in the decade.
2 Source: Loic Lemener, “The Great Debate”, Jan 22, 2016.
3 The MSCI EAFE Index is a stock market index used to measure the performance of stock markets around the world in industrialized countries outside of the United States and Canada.
4 Source: MSCI data from 1/1/90 to 12/31/15.
5 Source: MSCI as of 3/31/16.
6 Source: Barclays.
This commentary is prepared by Pekin Hardy Strauss, Inc. (dba “Pekin Hardy Strauss Wealth Management”, “Pekin Hardy”) for informational purposes only and is not intended as an offer or solicitation for the purchase or sale of any security. The information contained herein is neither investment advice nor a legal opinion. The views expressed are those of the authors as of the date of publication of this report, and are subject to change at any time due to changes in market or economic conditions. Pekin Hardy Strauss Inc. cannot assure that the type of investments discussed herein will outperform any other investment strategy in the future. Although information has been obtained from and is based upon sources Pekin Hardy believes to be reliable, we do not guarantee their accuracy. There are no assurances that any predicted results will actually occur. Past performance is no guarantee of future results. The S&P 500 Index measures an index of 500 stocks chosen for market size, liquidity and industry grouping among other factors. MSCI World Index captures large and mid cap representation across 24 developed countries. The Nasdaq Composite Index is the market-capitalization-weighted index of the more than 3,000 common equities listed on the Nasdaq, and includes American depositary receipts, common stocks, and real estate investment trusts (REITs). The Appleseed Fund is distributed by Unified Financial Securities, LLC. (Member FINRA). Past performance is no guarantee of future results. The investment return and principal value of an investment in the Fund will fluctuate so that an investorʹs shares, when redeemed, may be worth more or less than their original cost. Small cap investing involves greater risk not associated with investing in more established companies, such as greater price volatility, business risk, less liquidity and increased competitive threat. Investment in international markets present special risks including currency fluctuation, the potential for diplomatic and political instability, regulatory and liquidity risks, foreign taxation and differences in auditing and other financial standards. Fixed income investments are affected by a number of risks, including fluctuations in interest rates, credit risks, and prepayment risk. In general, as prevailing interest rates rise, fixed income securities prices will fall. The value of funds that invest in commodities such as gold is highly dependent on the prices of the related commodity. The demand and supply of these commodities may fluctuate widely based on many factors. P/E (price/earnings) is computed by taking the price of the stock divided by the current earnings‐per‐share. Companies with high P/E ratios are more likely to be considered ʺriskyʺ investments.
As of 2/29/2016 Appleseed had the following allocation to the mentioned securities: FB – 0.00%, AMZN – 0.00%, NFLX – 0.00%, GOOG – 0.00%, Vanguard 500 Index Fund, HYG – 0.00%, Samsung Electronics – 3.92%.
You may obtain a current copy of the Fund’s prospectus by calling 1‐800‐470‐1029. You should carefully consider the investment objectives, potential risks, management fees, and charges and expenses of the Fund before investing. The Fundʹs prospectus and summary prospectus contains this and other information about the Fund, and it should be read carefully before investing. You may obtain a current copy of the Fundʹs prospectus by calling 1‐800‐470‐1029.