
“Viewed in the abstract, the Federal Reserve System had the power to abort the inflation
at its incipient stage fifteen years ago or at any later point, and it has the power to end it today.
At any time within that period, it could have restricted the money supply and
created sufficient strains in financial and industrial markets to terminate inflation with little delay.
It did not do so because the Federal Reserve was itself caught up
in the philosophic and political currents that were transforming American life and culture.”
─ Arthur Burns, former Federal Reserve Chairman,
“The Anguish of Central Banking,” 1979
In response to the coronavirus pandemic, the U.S. government embarked on an unprecedented surge of fiscal spending and monetary easing that has continued unabated ever since. One year later, as the economy is starting to open up, inflation pressures are clearly rising, although it is still unclear whether these pressures will be transitory or not.
While finding appropriate historical analogies is always tricky, the current economic environment, in our view, seems most reminiscent of the mid-1960s. Those years represented an inflection point, much like today, when fiscal spending accelerated and the Federal Reserve financed that spending with low interest rates, assuming that historically low levels of inflation experienced in the early 1960s would continue. To be sure, inflation worsened considerably in the 1970s, but the foundation for accelerating inflation was built during the mid-to-late 1960s.
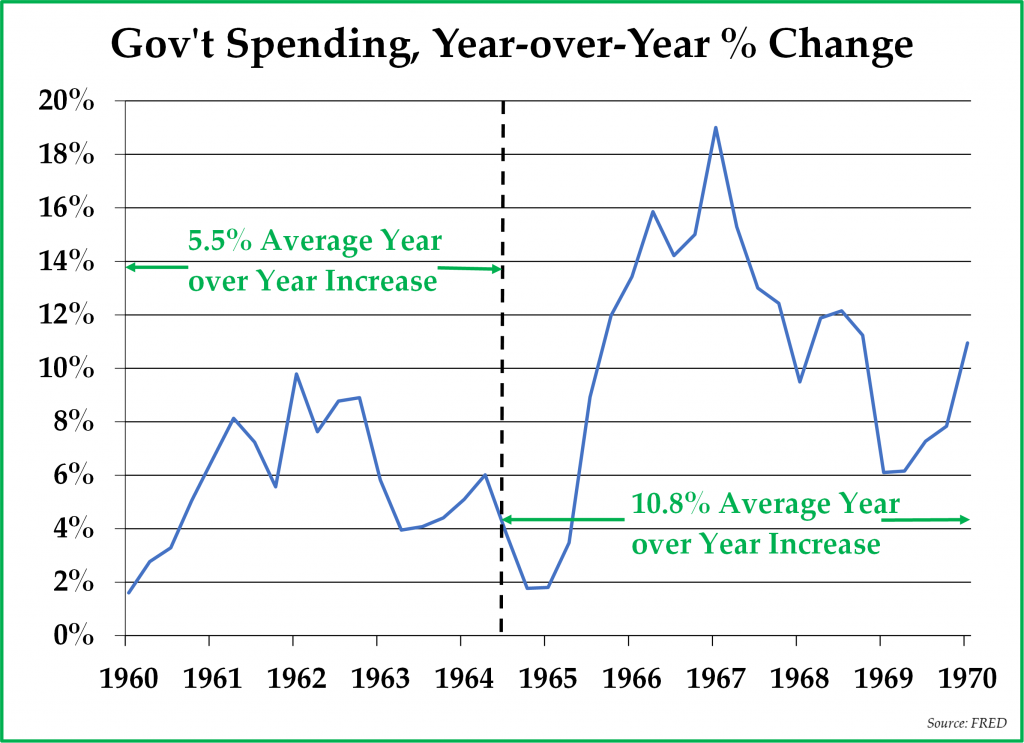
Upon his swearing-in, President Lyndon Johnson pursued an agenda that included an ambitious level of fiscal spending, following a significant tax cut that was passed in 1964. U.S. commitments in fighting the Vietnam War escalated even while domestic spending increased under the auspices of various Great Society programs that were intended to reduce minority unemployment and income inequality. Economists often refer to the era of the late 1960s as the “Guns and Butter” era, as that administration chose to pursue several ambitious goals at once, all of which required significant and sustained increases in fiscal spending along with an expanding budget deficit. The average year-over-year growth rate of government spending increased from 5.5% per annum from 1960 through 1964 to 10.8% per annum from 1965 through 1969 (see chart below).
Reminiscent of President Johnson’s 1964 tax cuts, President Donald Trump signed a large tax cut in 2017, even while the economy was growing at a reasonable rate and unemployment was low. President Trump also oversaw the largest fiscal expansion in U.S. history in 2020, as the Federal deficit reached an estimated $4 trillion, representing an estimated year-over-year increase in fiscal spending of 43%. With a new administration in place, President Joe Biden has communicated his intention to simultaneously pursue multiple sweeping goals. These goals include but are not limited to providing support for individuals and groups who have been economically harmed by the pandemic, combating climate change, making infrastructure investments, and providing Social Security and Medicare benefits to a growing population of retirees. Given the Biden administration’s ambitious plans, it is not unreasonable to assume that the budget deficit could remain around $3-4 trillion per year between 2021 and 2025, representing a fiscal expansion similar in magnitude to the one undertaken in the late 1960s.
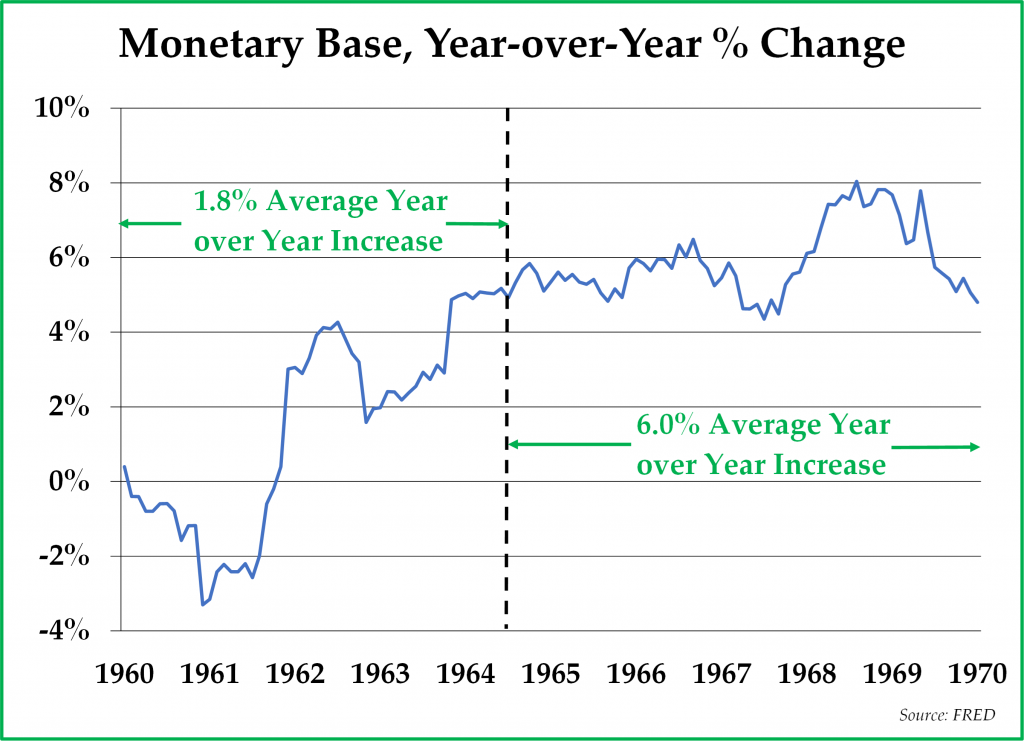
Early on in the Johnson administration, President Johnson met the Federal Reserve Chairman at the time, William McChesney Martin, and famously tried to intimidate him into keeping interest rates low and monetary policy accommodative. After the Federal Reserve raised interest rates in 1965, Johnson said to the Chairman, “Martin, my boys are dying in Vietnam, and you won’t print the money I need.” Although Martin was a strong proponent of an independent Federal Reserve and an anti-inflation hawk early in his career, he complied with President Johnson’s demands. Ultimately, Chairman Martin decided to provide monetary accommodation to fund the U.S. government’s spending plans, despite the inflation risk. The average year-over-year growth rate in the monetary base, which was 1.8% between 1960 and 1964, tripled to 6.0% between 1965 and 1969 (see chart below). Chairman Martin confessed his regret in acquiescing to President Johnson’s demands years later, saying, “to my everlasting shame, I finally gave in to him.” He stepped down from his position in 1970, but only after he had let the inflation genie out of the bottle.
Similar to what occurred in the 1960s, the current Federal Reserve’s independence has weakened considerably during the past year due to the current war on the coronavirus and the need to finance multi-trillion dollar annual fiscal deficits. In our view, the choice of former Federal Reserve Chair Janet Yellen as Treasury Secretary is symbolic of the marriage that seems to have occurred between the Federal Reserve and the U.S. Treasury department. Relatedly, the Federal Reserve is determined to protect the nominal value of financial assets and especially the value of U.S. Treasuries. Not doing so would likely have catastrophic consequences on the housing market, the stock market, and U.S. tax receipts, all of which are increasingly reliant on low interest rates. Even while the Consumer Price Index is likely to exceed 3% during Q2 2021 for the first time in years, current Federal Reserve Chairman Jerome Powell has communicated his view that the current inflationary pressures are transitory, assuming, like Chairman Martin, that inflation remains well-contained. While Chairman Powell may well turn out to be correct, we suspect that $4 trillion dollars per year in fiscal deficit spending facilitated by a 0% Federal Funds rate and a skyrocketing money supply is likely to be a recipe for inflationary acceleration.
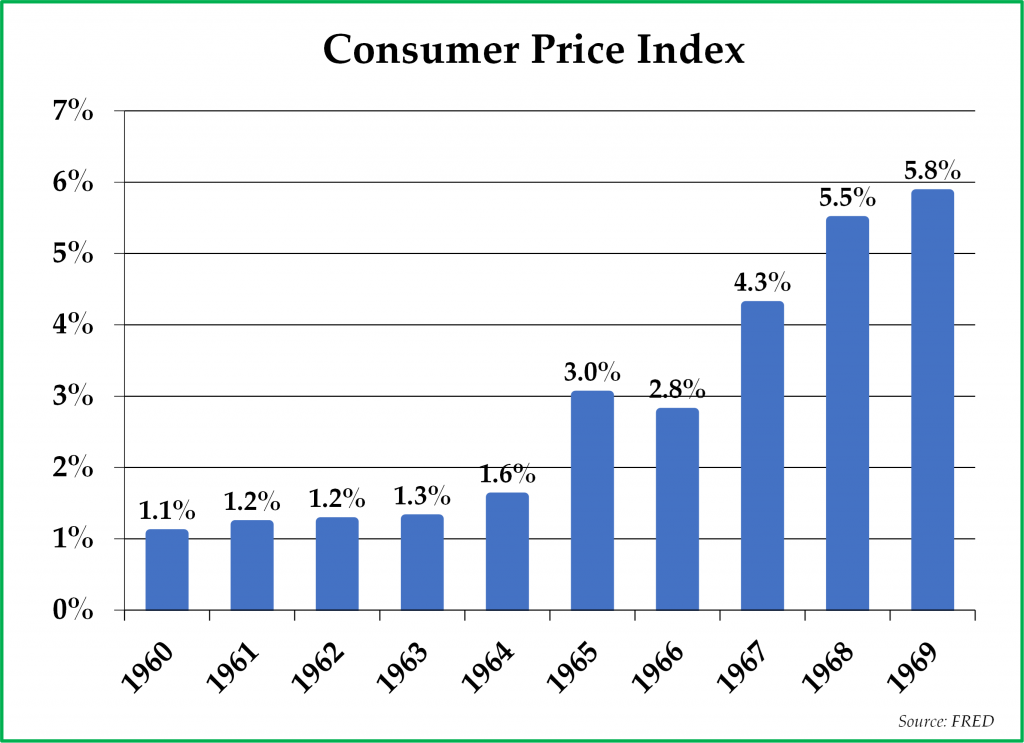
The spending during the Guns and Butter era created inevitable inflationary pressures that continued through the 1960s. During the early 1960s, inflation was well-contained, with the Consumer Price Index fluctuating in a relatively tight range of 1.1% to 1.6%. With increasing fiscal commitments and money supply in the late 1960s, however, inflation accelerated. In 1966, the Consumer Price Index increased by 3.0%, and by 1969, the Consumer Price Index increased by as much as 5.8%. Similarly, in the past five years, inflation has been low and contained, comparable to the inflation rate of the early 1960s. The average year-over-year increase in the Consumer Price Index was just 1.8% from 2016 through 2020. We will not know the early 2020s inflation rate until the future unfolds, but we would not be surprised to see an acceleration that rhymes with the late 1960s.
Important similarities exist between the late 1960s and the current era, but there are also important differences. The dollar is no longer pegged to the gold price, and the trade deficit has expanded significantly. Because U.S. government debt is currently so large relative to GDP, the Federal Reserve’s options are limited by the necessity of keeping debt service costs reasonable, regardless of the Fed’s inflation outlook. China has developed into a geopolitical and economic foe of the United States, and cheap imports from China have had a deflationary impact on the United States over the past twenty years. Finally, while the Biden administration is planning enormous fiscal spending increases, significant income tax increases would dampen their inflationary impact. Put more simply, we see a lot of similarities to the 1960s, but the situation is complex and dynamic with many moving parts.
The 1970s are well known for being a period when inflation accelerated further even compared to the late 1960s. At some point, it may well be worth comparing the 1970s to the current era, but we believe it to be premature at this juncture. Before inflation reaches the 10% inflation rates of the 1970s, it must first reach the 5% inflation rates of the late 1960s, and for this reason we think the 1960s are a more applicable comparison for the next couple of years.
Having discussed the macroeconomic backdrop of the 1960s, let us now examine what happened to the primary asset classes during the five year period beginning on January 1, 1965:
- Stocks:
Adjusted for inflation, the S&P 500 Index generated a total return of 0.3% per year. Earnings increased by 0.6% per year adjusted for inflation. However, as is often the case when inflation increases, the P/E ratio of the S&P 500 Index contracted, from 18.8x to 15.8x, and the dividend yield increased from 2.9% to 3.5% between the beginning of 1965 and the beginning of 1970.
–
Today, the S&P 500 Index is currently trading with a P/E ratio of 33.7x and a dividend yield of 1.5%. Increasing inflation generally results in a contraction of P/E ratios and an expanding dividend yield. In our view, the risk exists that accelerating inflation today could result in a significant downward re-rating of U.S. stock prices.
– - Bonds:
In 1965, the yield-to-maturity on 10-year Treasury bonds was 4.2%; by the time the decade ended, the yield-to-maturity on that same bond, with five years remaining until maturity, was 8.2%. We estimate the total return of that Treasury bond from 1965-1969 to have been -33.1%, or -7.7% per annum, adjusted for inflation. Bonds woefully underperformed other asset classes during the late 1960s, as one might expect in any environment where bond yields are rising to compensate investors for increasing inflation expectations.
–
The yield-to-maturity on 10-year Treasury bonds is currently 1.7%, which means that the downside risk of a rise in bond yields is greater today than it was in 1965. This is one of the reasons is why we have been seeking bond alternatives.
– - House prices:
Housing performed better than bonds in the late 1960s but still did not keep up with inflation. House prices increased by 3.3% per year, but house prices declined by a slight -0.6% per year adjusted for inflation. Houses tend to keep up with inflation due to increases in wages, land costs, and construction costs, all of which occurred during the late 1960s.
–
In recent months, we have seen land prices, construction costs, and wages rising. All of these trends are contributing to house prices which should approximately keep pace with inflation, as they did in the late 1960s.
– - Gold:
During the Johnson administration, the dollar was pegged to gold at $35/ounce, and it was not yet legal for Americans to own physical gold during that period. However, demand for gold among Europeans increased significantly; during the 1960s, U.S. gold reserves dropped by 38%, from 15,800 tonnes to 9,800 tonnes as undervalued U.S. gold was shipped to Europe. After the dollar/gold peg was removed in 1971, gold’s return was spectacular during the following decade as investors sought to sell dollars to invest in gold as a store of value.
–
While not an investment option in the late 1960s, gold is an attractive asset class for investors in the current era and should serve as an excellent long-term store of value should inflation continue to accelerate.
Looking back at how these asset classes performed in the late 1960s, the results seemed to coincide with the era’s inflationary circumstances. Housing and stocks were the relative winners, generating returns that kept up with, but did not exceed, inflation. The clear loser of the late 1960s Guns and Butter era was the bond market, which suffered from increasing bond yields and gradual erosion of purchasing power. We are also wary of bonds today and have been looking very closely at reasonable investment substitutes for bonds.
****
Before ending this letter, we wanted to comment on the weak gold price over the past six months. Our view is that the current weakness in the gold price represents a healthy correction and consolidation amid a secular bull market that is still in its early stages.
As we have discussed in past letters, the gold price tends to rise when real (inflation-adjusted) Treasury yields decline. Inflation has been increasing, to be sure, with commodities prices rising at a rapid rate ever since the Pfizer vaccine results were announced on November 1, 2020. However, commodity price increases are slow to be measured through the Consumer Price Index, which is a lagging economic indicator. Simultaneously, 10 year Treasury bond yields have increased in recent months from 0.5% to 1.7%. Because Treasury bond yields have been rising faster than the Consumer Price Index, real, inflation-adjusted, Treasury bond yields have been rising too (see chart below).
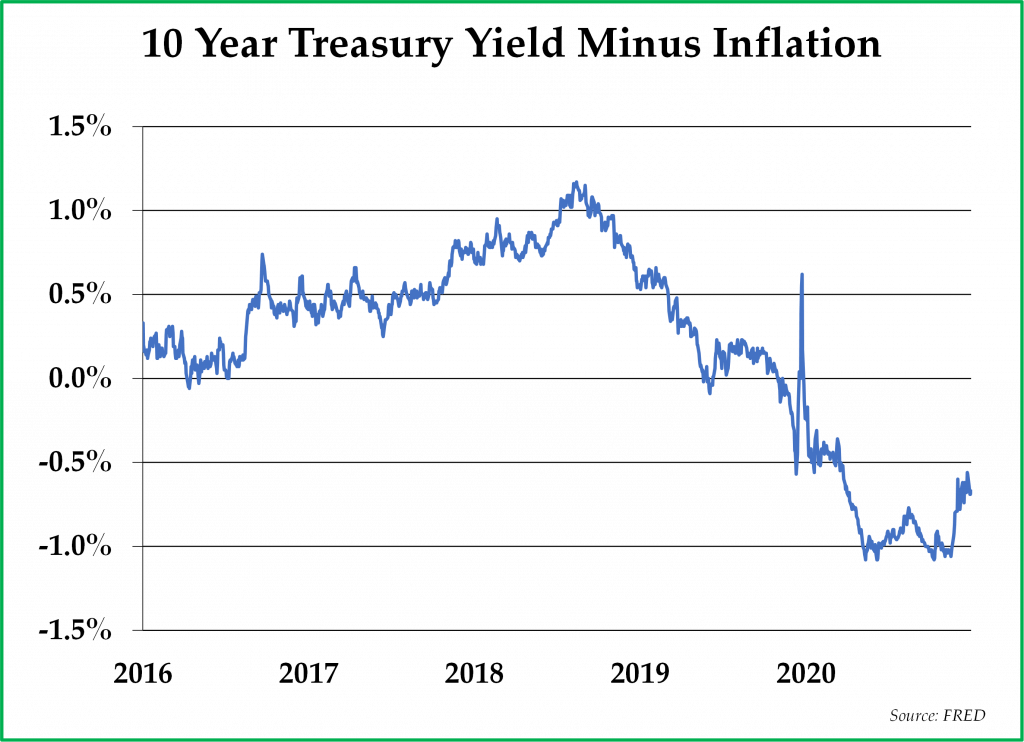
When real Treasury yields decline, it tends to be a tailwind for gold prices, and that is what happened from November 2018 through August 2020. When real Treasury yields increase, it tends to be a headwind for gold prices, and that is what has been happening since August 2020. Looking forward, we expect the Consumer Price Index to continue to rise, albeit not in a straight line, for many of the reasons outlined in this letter, while Treasury bond yields are likely to be capped by the Federal Reserve well before 10-year interest rates reach 2.5%.
Moreover, the international monetary system is in an increasingly tenuous position; we expect future crises such as the one that occurred in spring 2020, and gold will demonstrate its resilience during those crises. We remain bullish on gold and expect it to be one of the winners of the current Guns and Butter era.
*****
We hope you are well and are having the opportunity to enjoy the warmer spring weather. We remain grateful as ever for the trust that you have placed in us and for the opportunity to be working with you in planning your financial future.
Sincerely,
Pekin Hardy Strauss Wealth Management
This commentary is prepared by Pekin Hardy Strauss, Inc. (dba Pekin Hardy Strauss Wealth Management, “Pekin Hardy”) for informational purposes only and is not intended as an offer or solicitation for the purchase or sale of any security. The information contained herein is neither investment advice nor a legal opinion. The views expressed are those of the authors as of the date of publication of this report, and are subject to change at any time due to changes in market or economic conditions. Although information has been obtained from and is based upon sources Pekin Hardy believes to be reliable, we do not guarantee its accuracy. There are no assurances that any predicted results will actually occur. Past performance is no guarantee of future results. The S&P 500 Index includes a representative sample of 500 hundred companies in leading industries of the U.S. economy, focusing on the large-cap segment of the market. The Consumer Price Index (CPI) is an unmanaged index representing the rate of the inflation of U.S. consumer prices as determined by the U.S. Department of Labor Statistics.