Photo by duncanandison
“Those who have knowledge, don’t predict. Those who predict, don’t have knowledge.”
− Lao Tzu
In our most recent investor commentary, we discussed the drivers for the stock market downturn during Q4 2018. We suggested that monetary tightening from central banks across the world was the primary culprit in deflating equity prices. Specifically, we postulated that markets would remain weak without a reversal in quantitative tightening. And, in January 2019, the Federal Reserve did a stunning about-face and reversed its interest rate tightening stance. This policy reversal helped to drive the U.S. equity markets to the best start to the year since 1998.
The Federal Reserve’s reversal also sparked rising bond prices, and the corollary to higher bond prices is lower interest rates. However, a particularly foreboding sign raised its ugly head in the debt markets for the first time since 2007 − the U.S. Treasury yield curve inverted in late March 2019. Historically, this unique anomaly has occurred when GDP growth is slowing, when the risk of recession is increasing, and/or when investors expect central banks to reduce short-term interest rates – much like we discussed at length in our January investor letter.
The Inverted Yield Curve
The yield curve is defined as the relationship between short-term and long-term interest rates of government debt. Most of the time, short-term interest rates are lower than long-term interest rates, so the yield curve slopes upwards, reflecting higher returns for longer-term bond investments. In the United States, the short-end of the yield curve is controlled by the Federal Reserve, which sets short-term interest rates. The long-end of the yield curve is generally governed primarily by inflationary expectations, which are subject to the whims of bond market participants.1
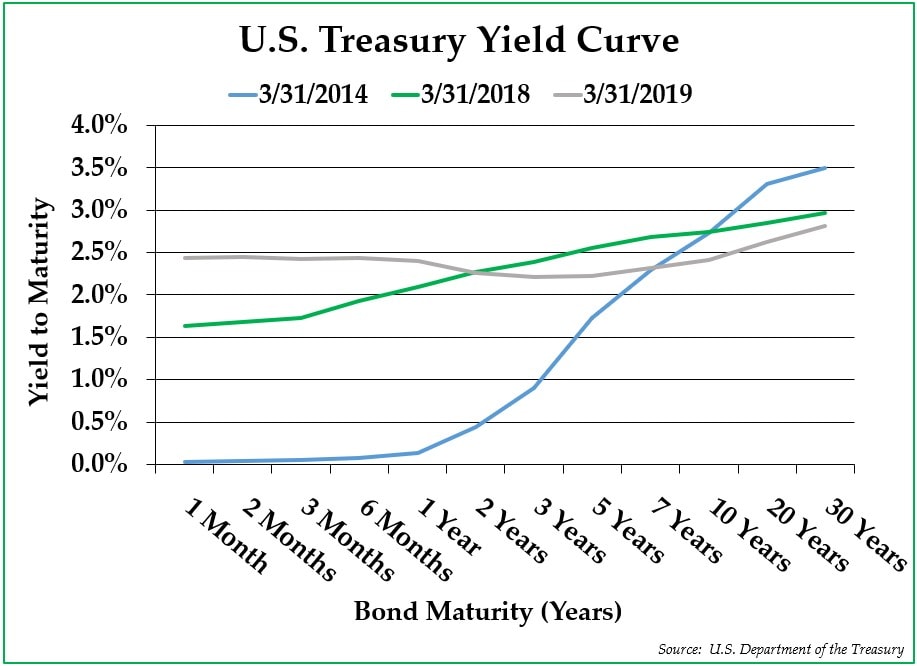
Intuitively, it makes sense for long-term interest rates to be higher than short-term interest rates. Investors typically expect to get paid more for tying up their capital for a longer period of time. For most of the past decade during which the economy has been growing steadily, investors have faced an upward-sloping yield curve. On the graph on the next page, the blue yield curve from five years ago (3/31/2014) is a prime example of an upward-sloping yield curve, and a more gentle but still upward-sloping example is the green yield curve from one year ago (3/31/18) on the same graph.
Late in economic cycles, the yield curve often flattens. As economic activity reaches a more mature part of the cycle, short-term interest rates tend to increase. At the same time, the long-end of the yield curve can be pressed downwards as investors increasingly expect weaker GDP growth and inflationary expectations.
Sometimes, the yield curve inverts, as it did in late March 2019. In an inverted yield curve situation, long-term interest rates are lower than short-term interest rates, which, on the surface, seems counterintuitive. The inverted grey yield curve in the graph below is a reflection of the last trading day of this past quarter.
The Cause of Yield Curve Inversions
As recessionary fears increase, long-term interest rates trend lower in reaction to increased buying of long-term Treasury bonds. Investors who worry about recession become inclined to buy longer-term securities immediately to lock in higher current yields, coincident with falling inflationary expectations.
Contemperaneously, late in the economic cycle, the Federal Reserve often increases interest rates to dial down economic growth and tamper inflation, which keeps the short-end of the yield curve high. With higher short-term rates and lower long-term rates, lo and behold, the yield curve inverts.
The Impact of an Inverted Yield Curve
The influence of an inverted yield curve can be significant. When the yield curve inverts (even by just a very small percentage, like it did recently), it reflects the fact that investors believe that the risk of recession is accelerating.
The chart below shows the yield spread between the 10-Year Treasury bond and the 90-Day Treasury bill. Any data points below the black line reflect a period of time when the yield curve was inverted. As demonstrated, an inverted yield curve preceded the last three recessions. In fact, the inversion of the yield curve occurred before every single one of the post-World War II recessions.

When the yield curve is steep and upward-sloping, it typically points to higher inflation, which is, in turn, associated with faster economic growth in the years to come than in the immediate future. Of course, when the yield curve is inverted, the curve implies slower economic growth and lower inflation in the years to come.
However, an inversion is not just a technical market signal; its very shape reduces profitability for the banking sector. If bank assets (loans with longer maturities) generate less income than bank liabilities (short-term customer deposits), then banks have little incentive to make new loans. As a result of declining credit availability, economic growth starts to slow. Furthermore, banks tend to tighten lending standards when the yield curve inverts, making it incrementally harder for borrowers to obtain loans. Thus, the yield curve can be viewed as more than just a leading indicator for future recessions; its inverted shape can also help to cause recessions.
From the perspective of investors, yield curve inversion eliminates the risk premium for long-term fixed income investments, allowing investors to obtain attractive yields with short-term debt investments. Plus, one often sees the risk premium between short-term Treasuries and riskier investments narrow, thus making short-term Treasuries and other short-term high-grade fixed income securities relatively more attractive. In addition, due to an increasing risk of recession, investors often get nervous about owning stocks when the yield curve inverts.
Is This Time Different?
Famed investor Sir John Templeton correctly pointed out that the phrase, “This time is different,” have been proved time and again to be the most expensive four words for investors. In 2000, consensus thinking was that the fiscal surplus and the dearth of longer-dated Treasuries would cause the inverted yield curve signal to be less relevant. The subsequent Dot-Com implosion proved this theory wrong. And, in 2006-2007, both consensus thinking and former Federal Reserve Chairman Ben Bernanke believed that the inverted yield curve was not a useful economic indicator due to the global savings glut at the time. The subsequent housing bust and Credit Crisis also proved them wrong.
As for today, former Federal Reserve Chairman Alan Greenspan is among the market pundits who believe that the recent yield curve inversion is a false recession indicator, since, in his view, long-term bond prices are buoyed by heavy investor demand. Given the recent exuberance of the stock market, it is apparent that stock market investors also do not believe, at least for now, that a recession is forthcoming anytime soon.
Indeed, we would be remiss not to mention the fact that there are unique aspects to the economic situation today that could limit the predictive impact of the recent inverted yield curve:
- Markets are highly manipulated.
After a decade of unprecedented market manipulation by the Federal Reserve and other central banks, long-term interest rates across the world stand at historically low levels. The global bond market is roughly $100 trillion in size, and close to 8% of the total bond market shockingly now sports a negative yield as a result of intensive central bank bond manipulation. To some investors, the manipulation of the capital markets makes it difficult to point definitively at an inverted yield curve as an accurate market predictor.
- Financial regulations have caused financial institutions to buy more Treasuries.
Following the Financial Crisis, new financial regulations were put into place to ensure a more robust banking system. One new regulation is the liquidity coverage requirement, which requires financial institutions to hold a higher amount of high quality liquid assets (i.e., Treasuries). As a result, financial institutions have become a price-insensitive buyer of long-dated Treasury bonds.
- The Federal Reserve seems to be more reluctant to raise rates.
The Federal Reserve does not want to catch the blame for dampening economic growth. It seemingly only plans on raising rates significantly until after they see an actual, sustained spike in inflation rates.
- The inversion has already reversed itself.
The yield curve inversion only lasted a few days; as of this writing, the yield curve is now ever-so-slightly upward-sloping. Plus, the yield curve was inverted for a short time, so it is possible that it was nothing but a head fake.
- Policy changes could stimulate the economy.
Policy-driven catalysts could drive asset prices upwards, including but not limited to:- A resolution of the U.S./China trade war and/or a negotiated decline in the value of the U.S. dollar, similar to what transpired at the 1985 Plaza Accords, could be highly stimulative for the U.S. economy.
- Increased quantitative easing, likely in the form of interest rate cuts, could nudge investors back into risky assets.
Historically, the inverted yield curve has been a useful leading indicator of weakening economic activity. Of course, we simply do not know if it will continue to work in the future based on the reasons listed above, but there is no structural reason to think that the indicator has broken down. In short, our view is that we see little compelling evidence to convince us that it is different this time. We would suggest that the chance of recession has increased significantly in recent months.
Following the wise words of the famed Chinese philosopher, Lao Tzu, we try not make significant investment decisions based on any sweeping predictions. Yes, the inverted yield curve sends an ominous signal, but we continue to believe it is prudent to own a diversified portfolio of uncorrelated, reasonably valued asset classes. Due to elevated equity valuations, we remain underweight stocks compared to our strategic allocation targets. Many stocks have a poor risk-reward profile currently, but not all, and we are unafraid of buying the shares of those stocks that are priced attractively. We are also increasing our allocation to foreign stocks, whose valuations are less lofty. With your fixed income investments, we are continuing to keep bond maturities short and credit quality high.
To be fair, please keep in mind that the best way to plan for a recession on an individual level is to try to make prudent overall financial choices, exactly as you would even if you did not believe that a recession was likely in the near term.
We thank you again for trusting us as your financial advisor. We hope that you will not hesitate to reach out to any of us with your questions and concerns.
Sincerely,
Pekin Hardy Strauss Wealth Management
This commentary is prepared by Pekin Hardy Strauss, Inc. (dba Pekin Hardy Strauss Wealth Management, “Pekin Hardy”) for informational purposes only and is not intended as an offer or solicitation for the purchase or sale of any security. The information contained herein is neither investment advice nor a legal opinion. The views expressed are those of the authors as of the date of publication of this report, and are subject to change at any time due to changes in market or economic conditions. Although information has been obtained from and is based upon sources Pekin Hardy believes to be reliable, we do not guarantee its accuracy. There are no assurances that any predicted results will actually occur. Past performance is no guarantee of future results.