
“I’m still trying to process why long-end interest rates are increasing.
─ Austan Goolsbee, President of the Federal Reserve Bank of Chicago
September 2023
The Bloomberg Aggregate Bond Index is the most well-known benchmark for the U.S. bond market. Over the past 20 years, annual investment returns from this index have averaged 3.0%, which is well below its longer-term average. Post-2020, investment returns from the bond market have been particularly weak, as demonstrated in the table on the right.1 Bond investors have been hurt by rising interest rates, which have stifled bond prices and limited total returns. For investors in Treasury bonds with maturities of more than 20 years, the investment losses since the peak of bond prices (and lows in yields) since August 2020 are commensurate with the losses sustained by equities in the S&P 500 Index during the Global Financial Crisis from peak to trough.2

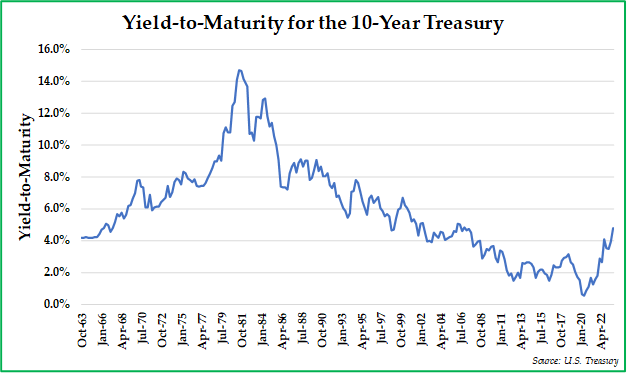
We highlighted in our January 2021 quarterly investment commentary the seemingly massive risks associated with the bond market at the time. At the time of publication, the 10-year Treasury bond’s yield-to-maturity was merely 1.1%, and the inflation-adjusted rate of return offered to investors was decidedly negative. Roughly 75% of the global bond market paid a yield-to-maturity of less than 1%, and only 10% of the global bond market offered a yield-to-maturity of more than 3%. A record number of global bonds traded with a negative yield-to-maturity, representing about $17 trillion in total value, which means that holders were guaranteed to receive a negative investment return from holding these bonds to maturity.3
The juxtaposition of the January 2021 bond market relative to today’s bond market could not be starker. Yields-to-maturity on the 10-year Treasury bond and the 30-year Treasury bond are higher than they were prior to the beginning of the Global Financial Crisis. For the last 18 months, the Federal Reserve has been raising short-term interest rates for the purpose of stemming rising inflation. Over the past 2.5 years, both short-term and long-term interest rates rose; however, since mid-summer 2023, the ascent in long-term interest rates since has been surprisingly violent and rather unexpected. Reflecting this trend, the yield-to-maturity on the 10-year Treasury is up 24% year-to-date and 825% since August 2020.4
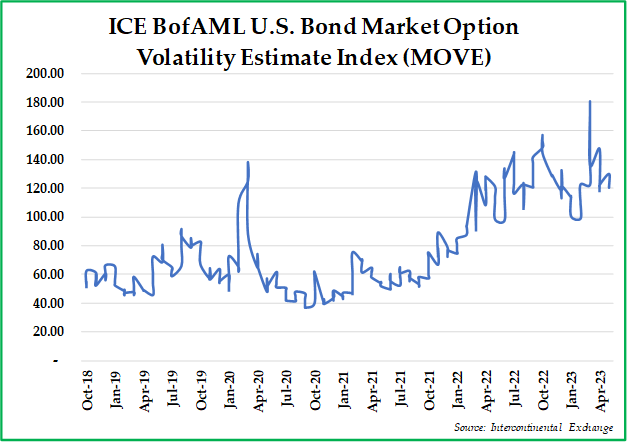
Notably, it is not just the absolute level of interest rates that have been rising; in addition, bond market volatility has tripled over the past two years. The ICE BofAML U.S. Bond Market Option Volatility Estimate Index (the MOVE Index) measures U.S. interest rate volatility. The MOVE Index helps to define general market risk and investor sentiment, meaning that recent swings upwards in the MOVE Index reflect increasing fears of future turmoil in the Treasury market.5
While Chicago Federal Reserve Bank President Austan Goolsbee claims that he is merely trying to process why long-term interest rates are rising, it seems to us that colossal Federal deficits are pressuring investors’ ability and/or willingness to absorb the enormous and increasing Treasury bond issuances that are taking place. Foreigners own roughly 30% of U.S. Treasuries, and demand from these investors has waned, particularly from China and Japan. Another large U.S. Treasury holder, the Federal Reserve, has been steadily selling off its holdings at a pace of ~$60 billion/month (along with an incremental ~$35 billion in mortgage-backed securities). Simultaneously, since the Federal government is running a significant $2 trillion deficit, the Department of the Treasury has been on a borrowing bender, raising $1.7 trillion in 2023 YTD, up a whopping 80% vs. 2022. In summary, the recent volatile and upward moves in interest rates mean that the immense size of the U.S. deficit and its worrisome trajectory are finally starting to matter.
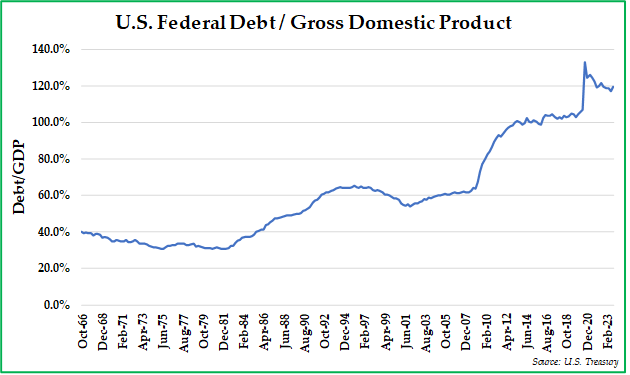
Today, the gross Federal debt stands at $33 trillion (and climbing), and U.S. government debt currently stands at 119% of GDP.6 These figures warrant some context – on a per person basis, this liability represents nearly $100,000 in Federal debt. Of the OECD nations, only Italy (151%), Greece (192%), and Japan (255%) currently have a greater debt/GDP ratio than that of the United States. With an assumed rise in interest rates of only 0.05%/year from current levels, the Congressional Budget Office (CBO) believes that debt/GDP will nearly double in the next 30 years to 231%.
Nearly 29% of Federal debt maturing in the next year will need to be refinanced from a near zero cost to an interest rate cost of 4.8% – 5.6%, depending on the duration of bonds auctioned.7 Interest expenses represented about 8% of total Federal outlays in 2022; by 2023, that share is projected by the CBO to rise to 14% and will exceed the costs generated by the Department of Defense as well as Medicaid. At the current trajectory of Federal spending and tax receipts, debt/GDP is anticipated to continue to climb at a high rate until interest expenses surpasses all other Federal programs within the next 30 years and will account for nearly 40% of Federal tax receipts.8
In the face of the recent dysfunction in Washington, we believe that it is more likely than not that the Federal government will merely kick the proverbial can down the road once again, as all options for reducing the debt/GDP ratio represent veritable career suicide. Beyond the growing interest expenses, the main contributors to future Federal deficits are Medicare and Social Security entitlement payments; cutting these entitlements would undoubtedly result in angry voters firing many of their D.C. representatives. In addition, defense spending is not likely to slow any time soon, given that the United States has embroiled itself in wars in Ukraine and in the Middle East. Increased income taxation is a somewhat improbable scenario for now, not only because of the lack of political consensus about taxation, but also because ironically it may reduce GDP growth. Ultimately, it seems that the politically palatable and realistic scenario is continued inflation to lower the future value of the U.S. debt burden and associated interest costs.
At some unknowable point in the future, these worsening deficit trends may cause the bond market to seize up, as it did in the March 2020, and the financial wherewithal of the U.S. Treasury would jump to front and center in investors’ minds. Such bond market gyrations would negatively impact all financial markets, given that the Treasury market is the market from which all other capital markets take their cues; the 10-Year Treasury interest rate is the most meaningful price for the most important asset across the globe. The Federal Reserve would have little choice but to act decisively in the face of a Treasury market crisis, should liquidity dry up, bond prices plummet, and yields spike.
Acting decisively would mean that the Federal Reserve would need to aggressively purchase Treasury bonds once again to cap borrowing costs, given the implied exploding interest costs and the considerable debt load borne by the Federal government. Instead of purchasing bonds directly, the Federal Reserve could modify regulations to nudge the banking system into buying more Treasuries. The policy term to describe these interest-rate-capping policies, whether direct or via the banking system, is “yield curve control.”
Yield curve control, once taken, would stand in direct contradiction with the Federal Reserve’s current policy, which is to keep interest rates higher for longer to stem the fires of inflation. Lowering the cost of debt capital in an inflationary environment would be stimulative and would stoke inflation that much more. It would also result in a depreciation in the U.S. dollar, such as what took place during the last major intervention in March 2020.
Should this scenario occur, we believe that yield curve control would impact various asset classes in the following ways:
- Bonds
With corporate credit spreads within historical ranges, investors are currently not paid exceptionally well to bear much credit risk, especially if the economy is heading into a recession. Long-dated Treasury bonds are particularly sensitive to interest rates and, in our view, still do not compensate investors adequately.
Meanwhile, short-dated U.S. Treasuries continue to represent particular value right now, as they offer a ~5.5% yield to maturity with no credit risk, limited interest rate risk, and near-zero liquidity risk. We discussed the attractiveness of this asset in detail in our investor commentary from last quarter.
- Stocks
Interest rate volatility weighs on stock prices, causing investor skittishness and compression of stock valuation multiples. As bonds increasingly offer higher yields, investors will incrementally move money from stocks to bonds. Should the Federal Reserve pivot and implement yield curve control, investors would quickly move back into stocks, as stocks would likely outperform bonds in a highly inflationary environment.
Historically, value stocks have demonstrated that they perform relatively better than growth stocks in an inflationary environment due to their already compressed valuation ratios. Sectors that historically have performed well in inflationary environments include energy, commodities, consumer staples, and agriculture.
- Alternative Investments
Real estate becomes a useful and popular store of value amid inflation while generating increased rental income. Tangible assets that have scarcity value like gold, silver, and uranium should rise in price with a depreciating dollar.
To clarify, we are not saying that yield curve control is hiding right around the bend. The combination of increased volatility in the Treasury market, spiking funding costs, growing political dysfunction, and mounting government deficits is likely to turn out to be a wicked cocktail for investors at some knowable point in the future. Investors are now beginning to recognize that the scale and trajectory of borrowing and absence of a viable solution are going to threaten markets and the economy in a way that has not been seen for a very long time.
Once again, we express our gratitude to our clients for trusting us with the management of their hard-earned capital. Should you have any questions about the contents of this letter, please reach out to us.
Sincerely,
Pekin Hardy Strauss Wealth Management
This commentary is prepared by Pekin Hardy Strauss, Inc. (dba “Pekin Hardy Strauss Wealth Management”, “Pekin Hardy”) for informational purposes only and is not intended as an offer or solicitation for the purchase or sale of any security. The information contained herein is neither investment advice nor a legal opinion. The views expressed are those of the authors as of the date of publication of this report, and are subject to change at any time due to changes in market or economic conditions. Pekin Hardy Strauss Inc. cannot assure that the type of investments discussed herein will outperform any other investment strategy in the future. Although information has been obtained from and is based upon sources Pekin Hardy believes to be reliable, we do not guarantee their accuracy. There are no assurances that any predicted results will actually occur. The Bloomberg US Aggregate Bond Index is a broad benchmark index for the U.S. bond market. The index covers all major types of bonds, including taxable corporate bonds, Treasury bonds, and municipal bonds. The S&P 500 Index includes a representative sample of 500 hundred companies in leading industries of the U.S. economy, focusing on the large-cap segment of the market. The MOVE index, or ICE BofA U.S. Bond Market Option Volatility Estimate Index, is a crucial gauge of interest rate volatility in the U.S. Treasury market calculated from options prices, which reflect the collective expectations of market participants about future volatility.
1 Source: www.bloomberg.com/markets/rates-bonds/blooberg-fixed-income-indices.
2 Source: www.bloomberg.com/markets/rates-bonds/blooberg-fixed-income-indices.
3 Source: Deutsche Bank.
4 Source: U.S. Treasury.
5 The data in the chart on the top of the next page looks more disjointed than that in many graphs, given the big moves in the MOVE Index that can happen from month-to-month.
6 Source: The Federal Reserve Bank of St. Louis.
7 Source: The Federal Reserve Bank of St. Louis.
8 Source: Peter J. Peterson Institute.